Global Competitiveness Report in Google Earth
Here's another Google Earth file with some current geospatial data. The World Economic Forum has released its 2006/2007 report which attempts to model the process of growth using all the complicated factors that affect countries. The U.S. has slipped. From 1st to 6th based on war and security spending.
If you already have Google Earth installed, check out the data by clicking HERE.  ken@stolasgeospatial.com
Tuesday, September 26, 2006
Saturday, September 23, 2006
Weekend Video - Man Behind the Maps Part II.
2nd installment of Billy McWilliams doing his part to keep Google Maps up and running.
Friday, September 22, 2006
National E. coli Reported Cases Map in Google Earth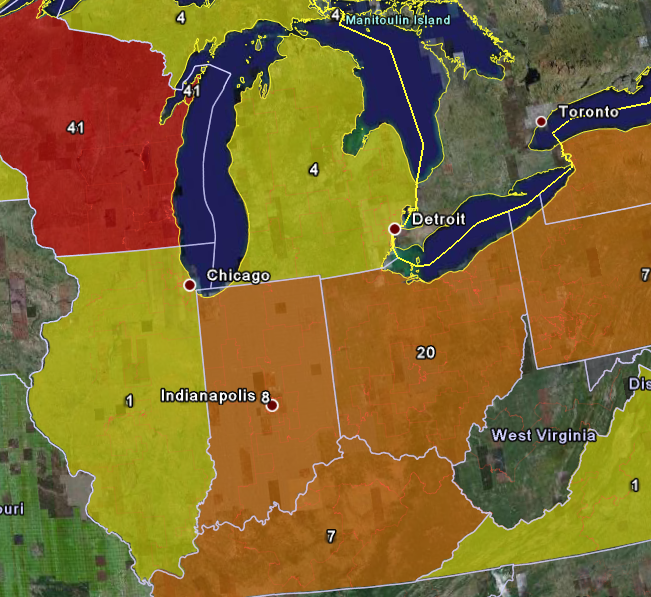
The FDA continues its crackdown on fresh spinach in hopes to bring an end to the current E. coli H157:H7 outbreak. On 9/21/2006 they released the number of illness reports per state.
We've created a simple thematic KML layer showing the number of reported cases per state for a client. Click HERE to open the KML file in Google earth to see the breakdown data (you must have Google Earth installed.)
E. Coli | Spinach | FDA | Google Earth
Wednesday, September 13, 2006
Geographic Spellcheck Strategy
I've grown tired of my Word spell checker constantly showing red underlines on my street names in Office documents. It would take months to type in all the road names into the dictionary if I wanted to use them during spellcheck. Then I realized I had a entire database of street names right in my shapefiles.
So I set out to create a Word custom dictionary in these steps:
1. Save out the road centerline file to DBF.
2. Open the DBF in Excel and delete all the columns but the road name.
3. Save As Tab Delimited.
4. Open in Word and make case changes (if necessary).
5. Copy the data into a Wordpad file. Save with a .dic extention.
6. Load the custom dictionary in Word! Viola!
Now I think I am going to do waterbodies, rivers, railways, airports, etc.....
Tuesday, September 05, 2006
Concept "Maps"
O.K. So these are not true geographic maps, but I think the design can be applied to cartography just the same. Applying some of their principles when presenting Metadata or Schemas would make for an awesome display board.
We develop a range of diagrams and maps to create, test, and refine architectures or organizational structures for the applications and sites we design. Maps created as design tools serve many of the purposes of maps created during audits — creating shared models for the team, uncovering problem areas, and serving as a reference for product managers and engineers.The examples come from Dubberly Design Office, via LifeClever. They are really sharp!

Subscribe to:
Posts (Atom)